Volumetric Mean Velocity Measurements in Turbulent Flows
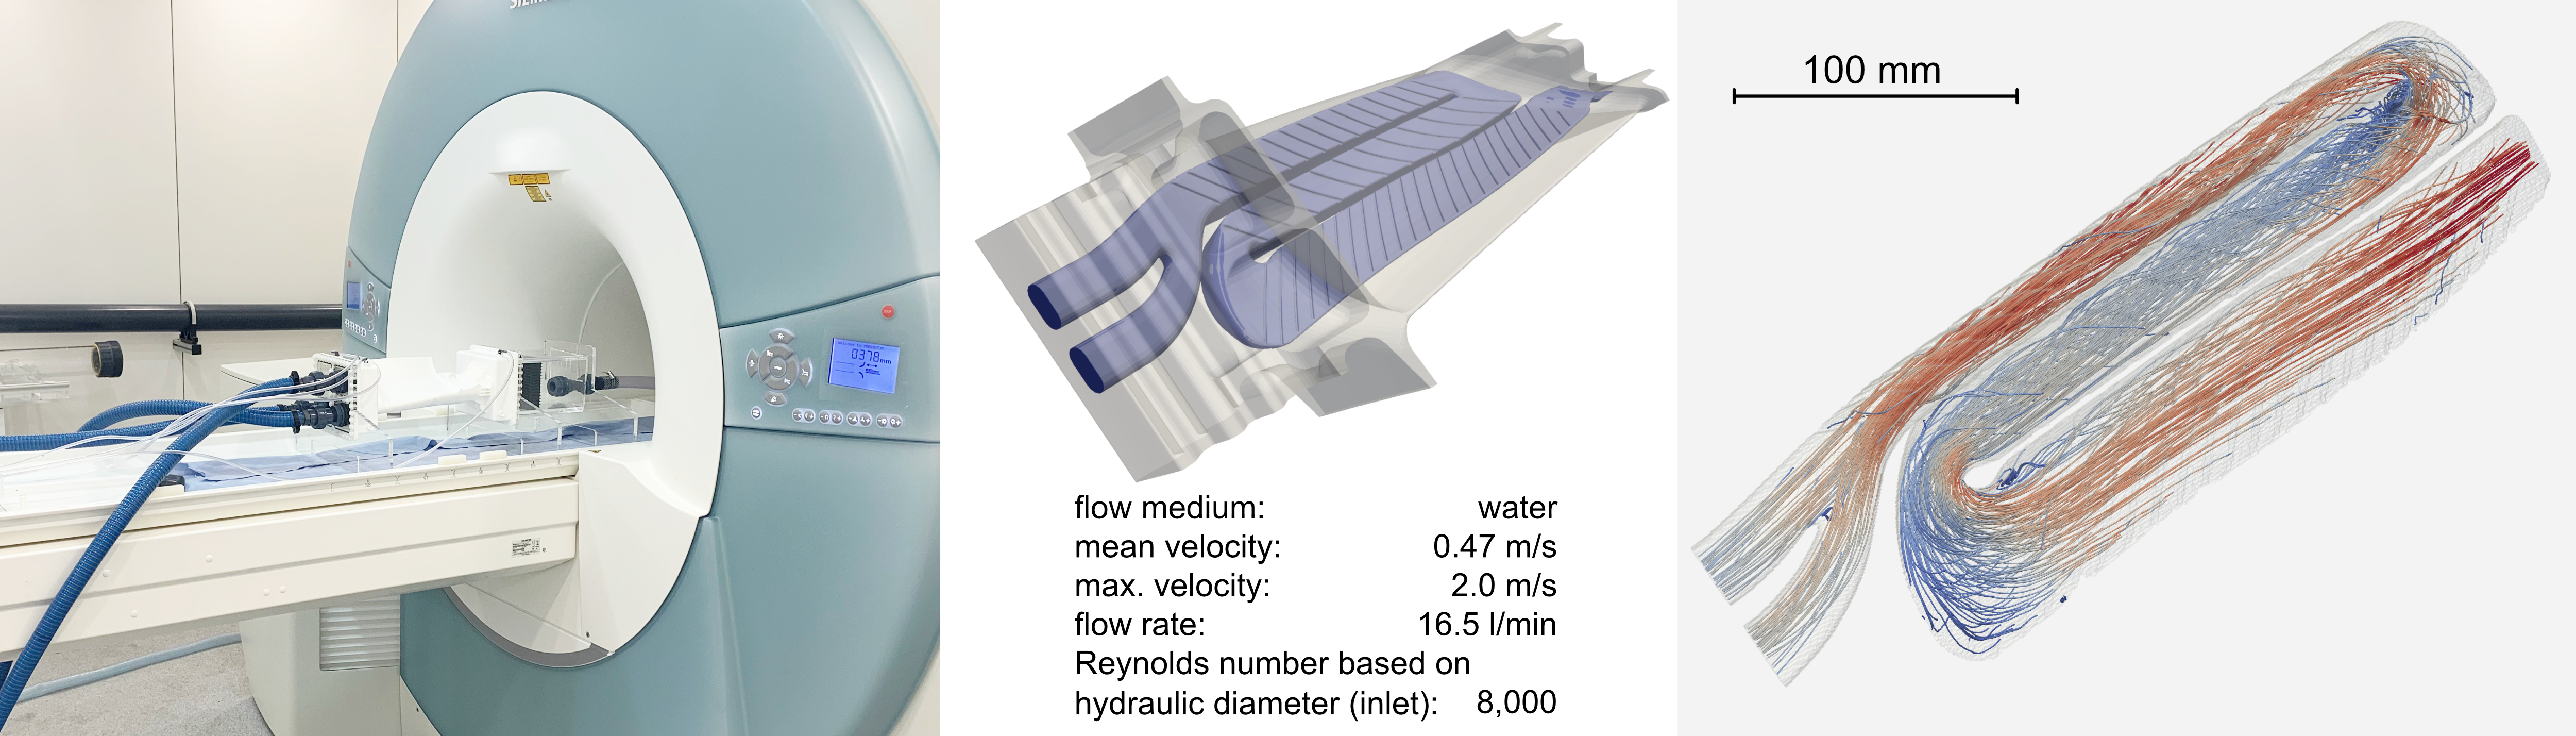
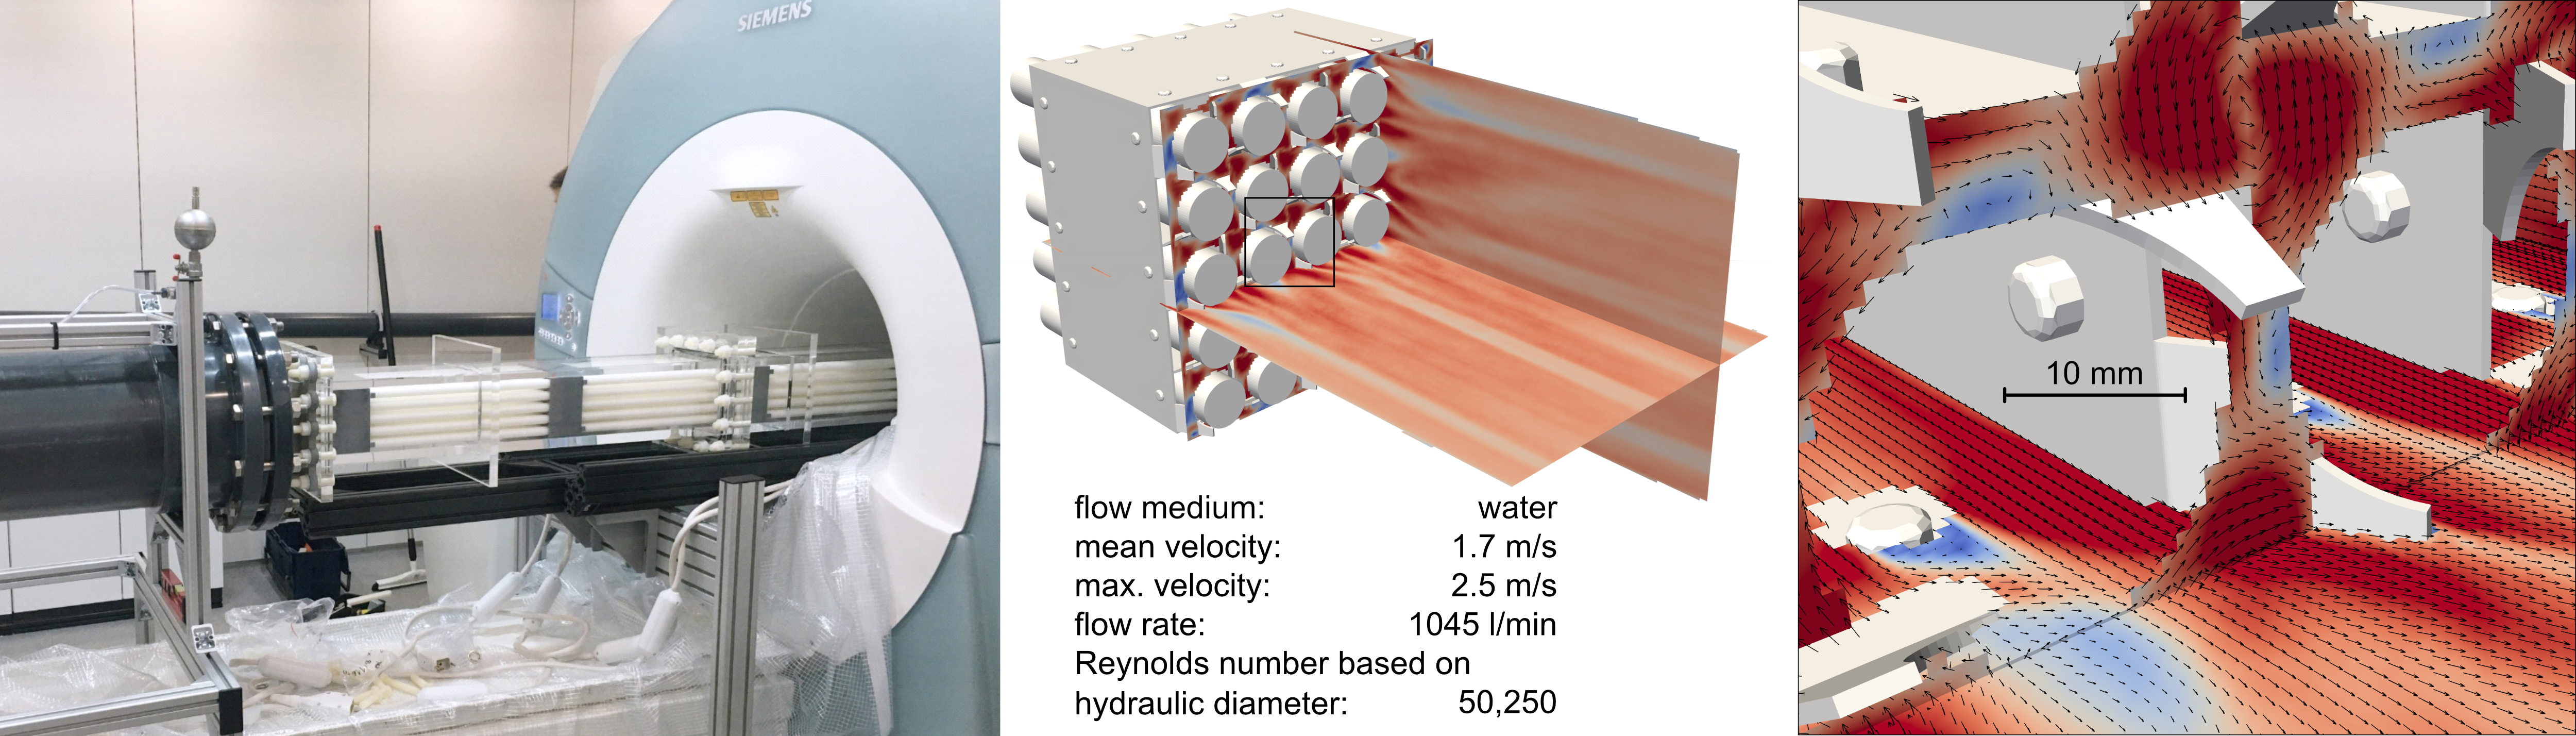
Three- or two-dimensional mean velocity measurements at the MRI Flow Lab are realized using phase contrast MRI. The velocity sensitivity ranges from 0.01 m/s to 15 m/s and depends on the imaging method. For most applications, the measurement accuracy is below 5% of the velocity sensitivity. A few impression of the data quality reached with this measurement technique are illustrated below.
Further reading:
Fukushima (1999). Nuclear magnetic resonance as a tool to study flow. Annual review of fluid mechanics, 31(1), 95-123. https://doi.org/10.1146/annurev.fluid.31.1.95
Bruschewski et al. (2019). Phase‐contrast single‐point imaging with synchronized encoding: a more reliable technique for in vitro flow quantification. Magnetic resonance in medicine, 81(5), 2937-2946. https://doi.org/10.1002/mrm.27604
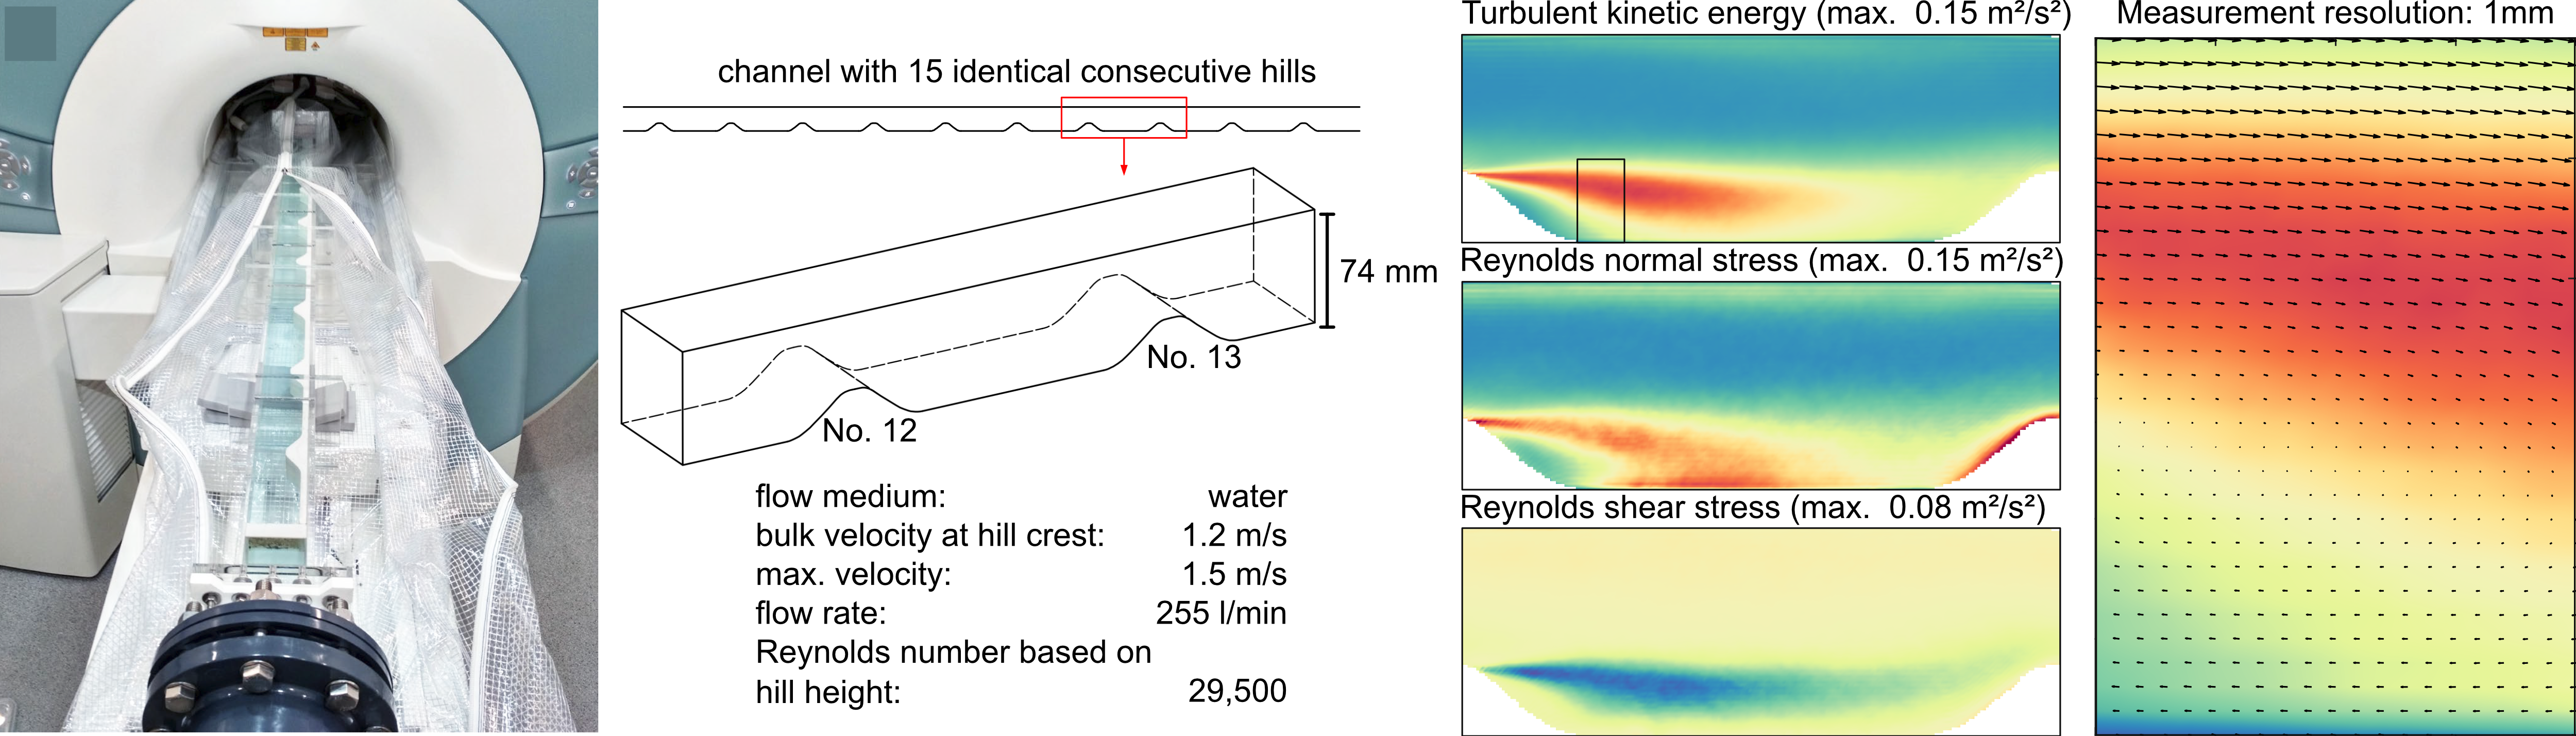
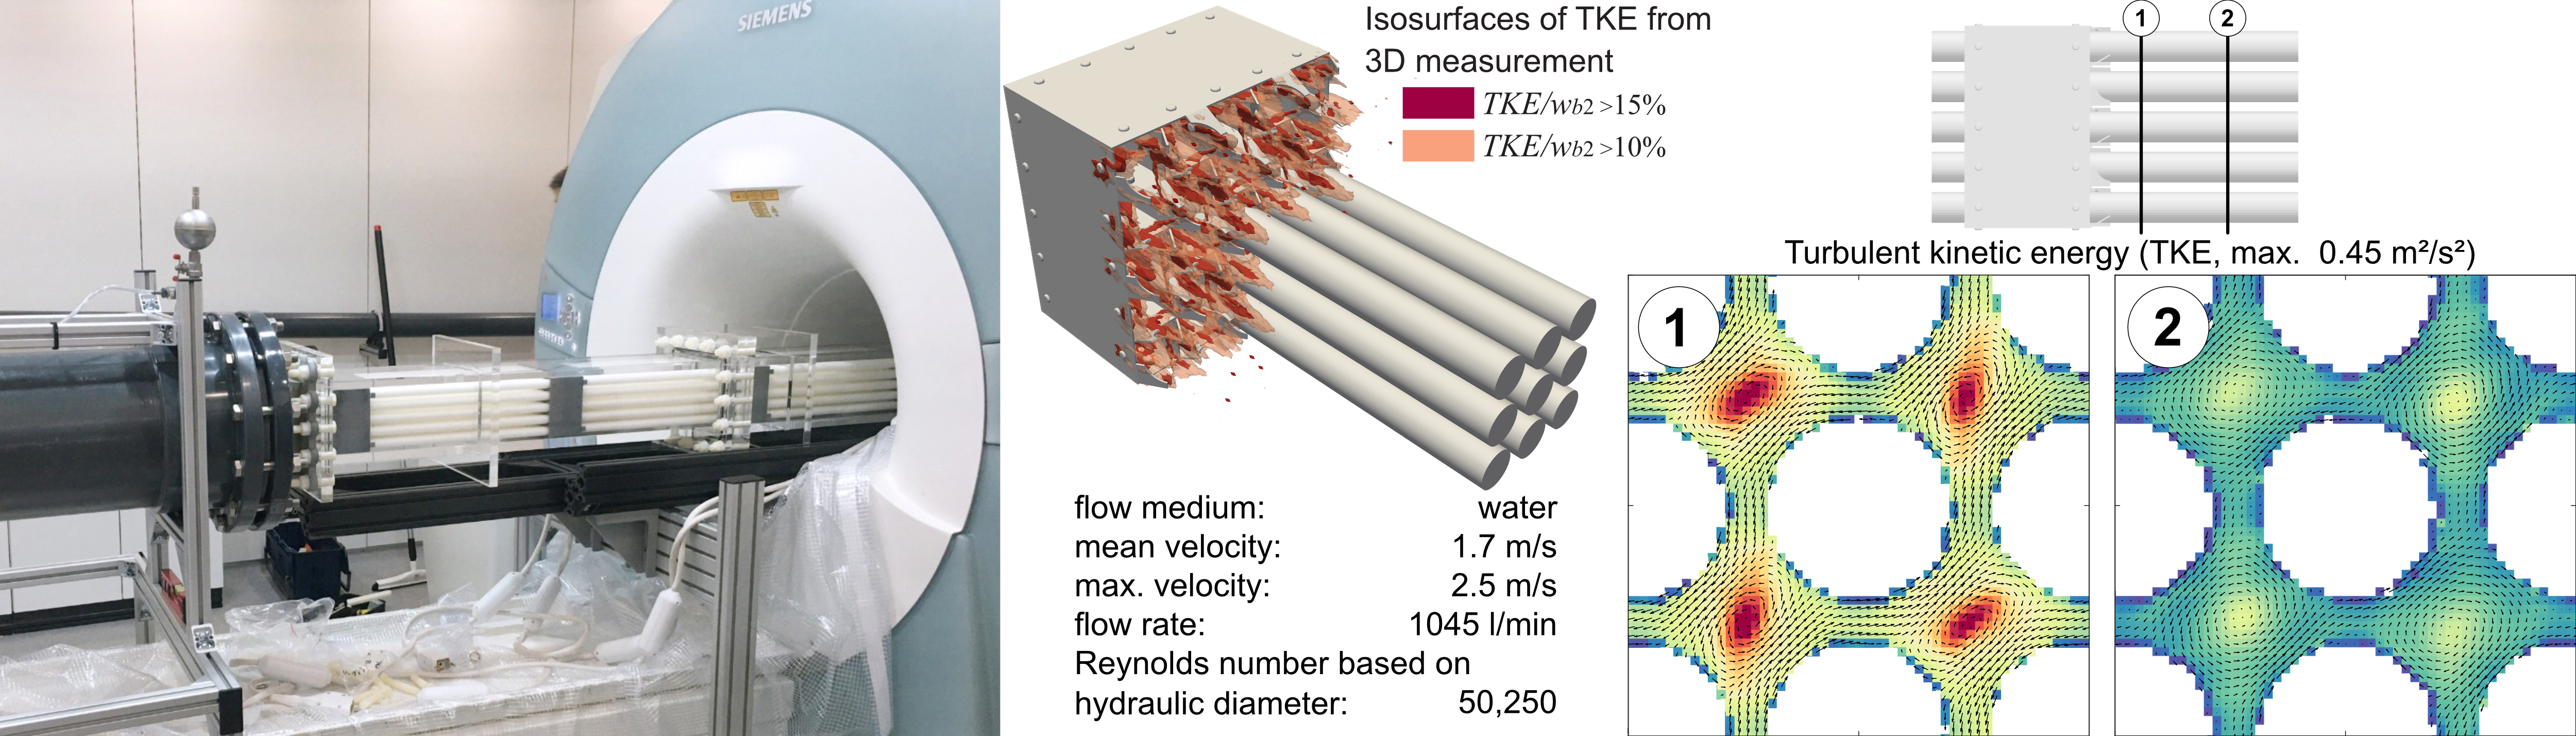
Turbulence Quantification
Turbulence quantification at the MRI Flow Lab is based on the signal loss that results from turbulent fluctuations. Assuming a Gaussian velocity distribution, the variance of the velocity can be calculated from a velocity sensitive MRI measurements. By using a ICOSA 6 encoding scheme it is feasible to quantify all six components of the symmetric Reynolds stress tensor. As for the mean velocity, the Reynolds stresses can be acquired in 2D or 3D measurements. Such measurement data is comparable to the results of Reynolds Averaged Navier Stokes (RANS) simulations.
Further reading:
Dyverfeldt et a. (2009). On MRI turbulence quantification. Magnetic resonance imaging, 27(7), 913-922. https://doi.org/10.1016/j.mri.2009.05.004
Schmidt et al. (2021). Reynolds stress tensor measurements using magnetic resonance velocimetry: expansion of the dynamic measurement range and analysis of systematic measurement errors. Experiments in Fluids, 62(6), 121. https://doi.org/10.1007/s00348-021-03218-3